No Broadband for you! What is 100/20? Broadband Speed Over Time
Article
•
April 20, 2022

No Broadband for you!
Fabion Kauker Chief Information Officer, Hexvarium
July, 2022
No Broadband for you! What is 100/20? Broadband Speed Over Time

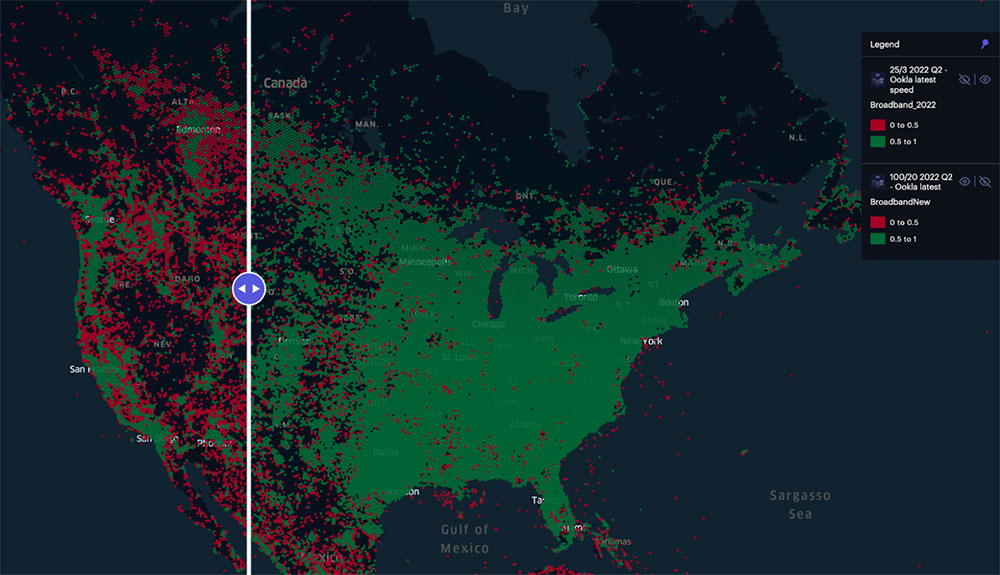
Flash news announcement… your internet isn’t BROADBAND anymore! That’s right the FCC has announced that if your ISP proclaims that it can deliver less than the potential new spec of 100Mbps down and 20Mbps up your connection is not broadband. [ref] [ref] But where and how does this affect the United States? All we have seen so far is the statements. So let’s make a map, that’s something we know how to do! Why does this matter? Well the BEAD funding seeks to address the Digital Divide and places that are under or unserved. Does that mean that I’m getting a shiny new fiber to the home connection? … Ugh maybe, if we can help it! As we start to deploy FTTH across the country the biggest challenge is identifying where customers and the Digital Divide exist. The reporting schedule of FCC 477 data makes it challenging to determine the current state of a location. Further this is always changing as new networks and technologies are deployed. Ala T-Mobile and fixed 5G. To address this we are using the public data from Ookla [ref]. Further the 477 data comes in blocks and soon Broadband Serviceable Locations Fabric. So, consistency and the ability to join cross year and data set are essential. We are using H3 hexagons for this purpose. This Ookla data comes in a grid and can be downloaded for anywhere in the world! There are some great visualizations of the data here, but we want to bring the data into H3 hexagon grids. Here we will explore how to take this starting grid data and transform it into Unfolded.ai HexTile. Then compare two time points in the data. Once all the data wrangling is done we want to answer the following questions: 1. What does the change from 25/3 to 100/20 look like? Map Link 2. Has connectivity improved over time? Map Link 3. What would it mean if the definition was 100/100 combined with # households?! Map Link We really want to be able to compare and see this at a large scale. So using a Split Map with Hextiles, then using expressions seems like a great way to accomplish this.
How To
These are runnable in the shared colab notebook here. Step 1: locate and download the data We’ll install the AWS CLI and then pass the config params to get the Ookla data. Step 2: load the data into BigQuery Define the schema and match the data types to the parquet files published to Google Cloud Storage. Step 3: Enrich the data with H3 Using the Carto H3 extensions in BigQuery we want to turn the square grid into hexagons. Note that this is not a one to one mapping. The resolution 9 hexagons are smaller but overlap in non-contiguous ways. We experimented with using Polyfill but it was too slow. Then using just the centroid, didn’t cover enough area. Using the corner points produces non-contiguous sub hexagons, even when you apply a negative buffer. Using the corners of the square Ookla grid:
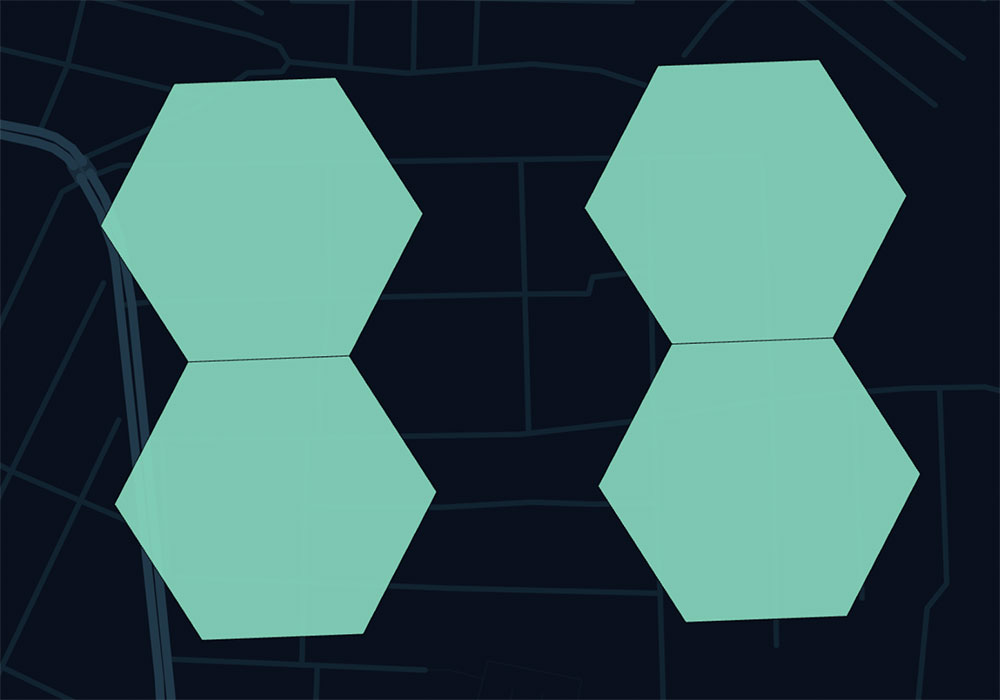
So we are left with using k-ring and the max of overlapping hexes. A random set of Ookla grid and H3 K-ring
 Step 4: Export BigQuery results and upload to unfolded
Using gcsfuse we can quickly download and then upload to unfolded studio using the SDK. Step 5: Create Hex Tiles This is as simple as a couple check boxes in the UI now! Step 6: Make the maps There is some magic in the queries to define what broadband is here are they key parts: max_d >= 100 & max_u >= 20 Then the more complicated delta between data is: max_d && old_max_d ? (max_d - old_max_d == 0 ? 0 : (max_d - old_max_d > 1 ? 1 : -1)) : 0
Why use Unfolded?
The Open5G team has a strong partnership with Unfolded, providing advice on how to apply and optimize the Unfolded platform for broadband analytics related workflows and problems. The Unfolded platform was designed to solve many of the challenges that broadband roll out and network coverage analysts face in their day-to-day work. Broadband and network rollout datasets by their nature cover entire countries and in the case of the USA, a large part of a continent. Such datasets are typically too large to load into memory, however Foursquare’s Hex Tile technology allows us to work interactively with continent sized datasets, while providing analytically consistent data views at all resolutions. The Unfolded platform also has a strong focus on temporal data. This enables not only standard split-screen before-after views, but also provides us with the ability to animate massive datasets in order to visualize their evolution over time. For network coverage data, animations can often be an effective way to highlight systematic patterns of under- and over- investment, Naturally, these animation capabilities are complemented with high-definition video export, so that we can easily share the resulting insights with others. Unfolded also provides a growing library of use-case focused analytic modules like hot spot and clustering analysis, as well as suitability analysis are available to quickly identify target areas for further study and/or investment. As part of the bigger Foursquare application suite, Unfolded can provide access to Foursquare Places and Foursquare visits which are some of the most comprehensive location datasets available, showing points of interest as well as foot traffic patterns. These datasets can then be combined with hex tiled network coverage to draw additional conclusions on how network coverage and roll out coverage correlate with other factors.
Conclusion
While the goal of 100/100 seems aspirational, 100/20 seems like a logical step that won’t make any one technology rule. However, the experienced speeds will need to be monitored. As we showed it is possible for speed to get worse over time in places. We are looking forward to engaging with potential collaborators and asking that you reach out if you have any questions or mapping or network business case requests! Send us an email at: fiber-planner@open5g.com
 A leading expert in data modelling, GIS mapping and network design, Fabion Kaukor brings extensive experience in developing solutions for global networks and multinational technology companies across cloud, fixed/wireless connectivity, computer software and business operations domains. Formerly VP of American Ops at Biarri Networks, Fabion is dedicated to solving last mile problems across many verticals.
About Hexvarium
Hexvarium is a broadband service provider using proprietary Data Science to accurately identify, deliver, and connect profitable networks across all geographies. Building sustainable broadband networks is a complex puzzle of continually changing factors. Yet all other designers, engineers and operators deploy capital using static, antiquated methods and knowledge of each community. Hexvarium’s approach delivers sustainable networks, even in the most challenging circumstances. For more information, please visit hexvarium.com.
Media Contact:
Jennifer Spoerri
Gallagher PR