Broadband Data Collection for ISPs (BDC part 1)
Article
•
May 15, 2023
FCC Broadband Data Collection for ISPs - Part 1
Rich Gibson, Engineer, Hexvarium
April 21, 2023
FCC Broadband Data Collection for ISPs
To create an improved National Broadband Map the FCC created new filing requirements for Broadband Providers. The Broadband Data Collection system replaces the old Form 477.
The first filing of the Broadband Data Collection (BDC) was due September 1st, 2022 for coverage as of June 30th, 2022. That data was then released on November 17, 2022, two and a half months after it was collected and only four and a half months after the end of the period.
If you are familiar with the pace of data releases of Form 477, where the data was released a full year after the period closed, you will appreciate both the opportunities that this timely data provides, as well as the challenges the pace puts on ISPs to file the BDC data.
Providers were still required to file the 477 data for 6/30/2022, but that was the last period for which providers were required to file the 477.
Providers can provide polygons of their coverage area or a list of the locations that are serviceable using the Location Fabric..
Steps in generating and filing the Broadband Data Collection Data
- Availability data by identifying the locations in the Location Fabric where service is available, as polygons or a list of locations.
- Create Subscription data by summarizing subscriber data based on Census blocks. (This is the same process used in the 477 subscriber file)
- Format the reports
- Upload filings to the FCC site
- Validate the data on the FCC site
- Add ‘supporting data.’
- Breathe a sigh of relief.
In the rest of this post, we’ll explore using the Location Fabric to generate a list of locations covering the first two steps. In part 3 of this series we will demonstrate ways to generate polygons for coverage areas.
Changes from the 477 requirements - the Location Fabric
The main change from the 477 filings is the addition of the Location Fabric. The
477 Fixed Broadband Deployment data was based
on census blocks. In addition, providers were required to report the
number of subscribers they had in each census block, as well as reporting the
availability of service by census block and technology.
The Broadband Data Collection does away with block-level reporting of availability data. (ISPs must still report subscriber data summarized by census block).
From the FCC site “The Broadband Serviceable Location Fabric (Fabric) is a dataset of all locations” in the United States and Territories where fixed broadband internet access service is or could be installed.
The FCC contracted with CostQuest to develop this list of all broadband serviceable locations. Read about the FCC Broadband Serviceable Location Fabric.
Providers are required to sign a license agreement with CostQuest to use the Location Fabric. You specify the counties that you operate within, and then they provide a list of all of the serviceable locations within these counties. When you are ready, read about executing the license agreement with CostQuest to get access to the Fabric.
Layout of the Location Fabric.
- Location ID: The unique FCC assigned number for each location.
- Latitude/Longitude: Location of the location. This should be at the rooftop level.
- Address: street, city, state, zip, zip+4
- Unit Count: the number of units in the location
- BSL: ‘Broadband Serviceable Location’ True or False, whether the location can be serviced.
- Building Type Code: Business, Residential, Both, unknown
- Census Geographies: County FIPS and census block
- h3 hex id: The h3 level 9 hex id of the location.
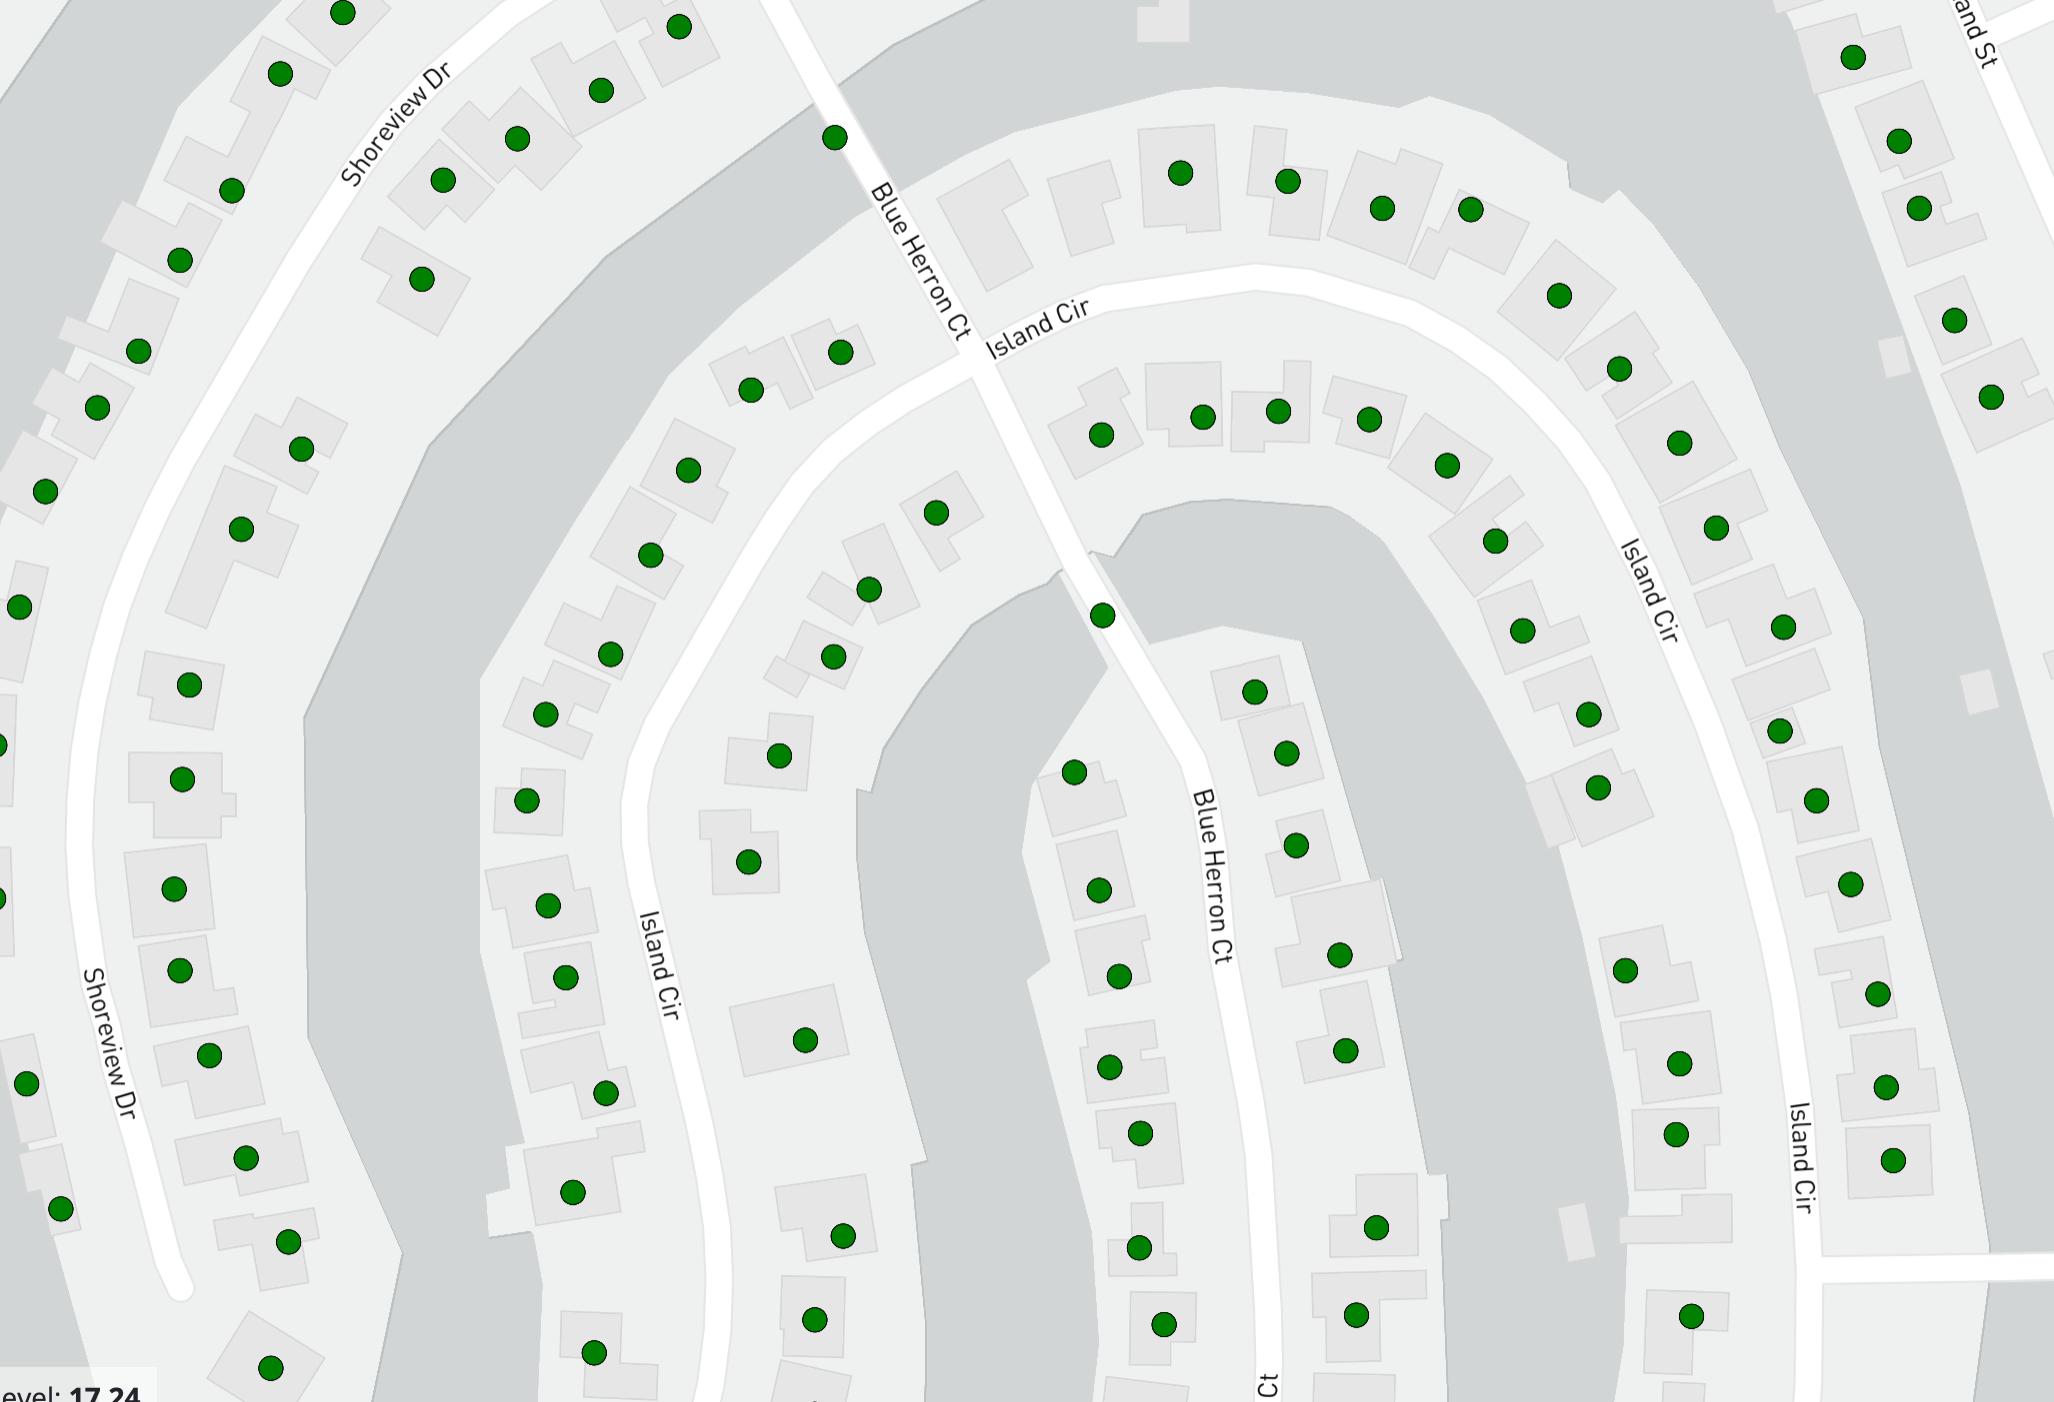
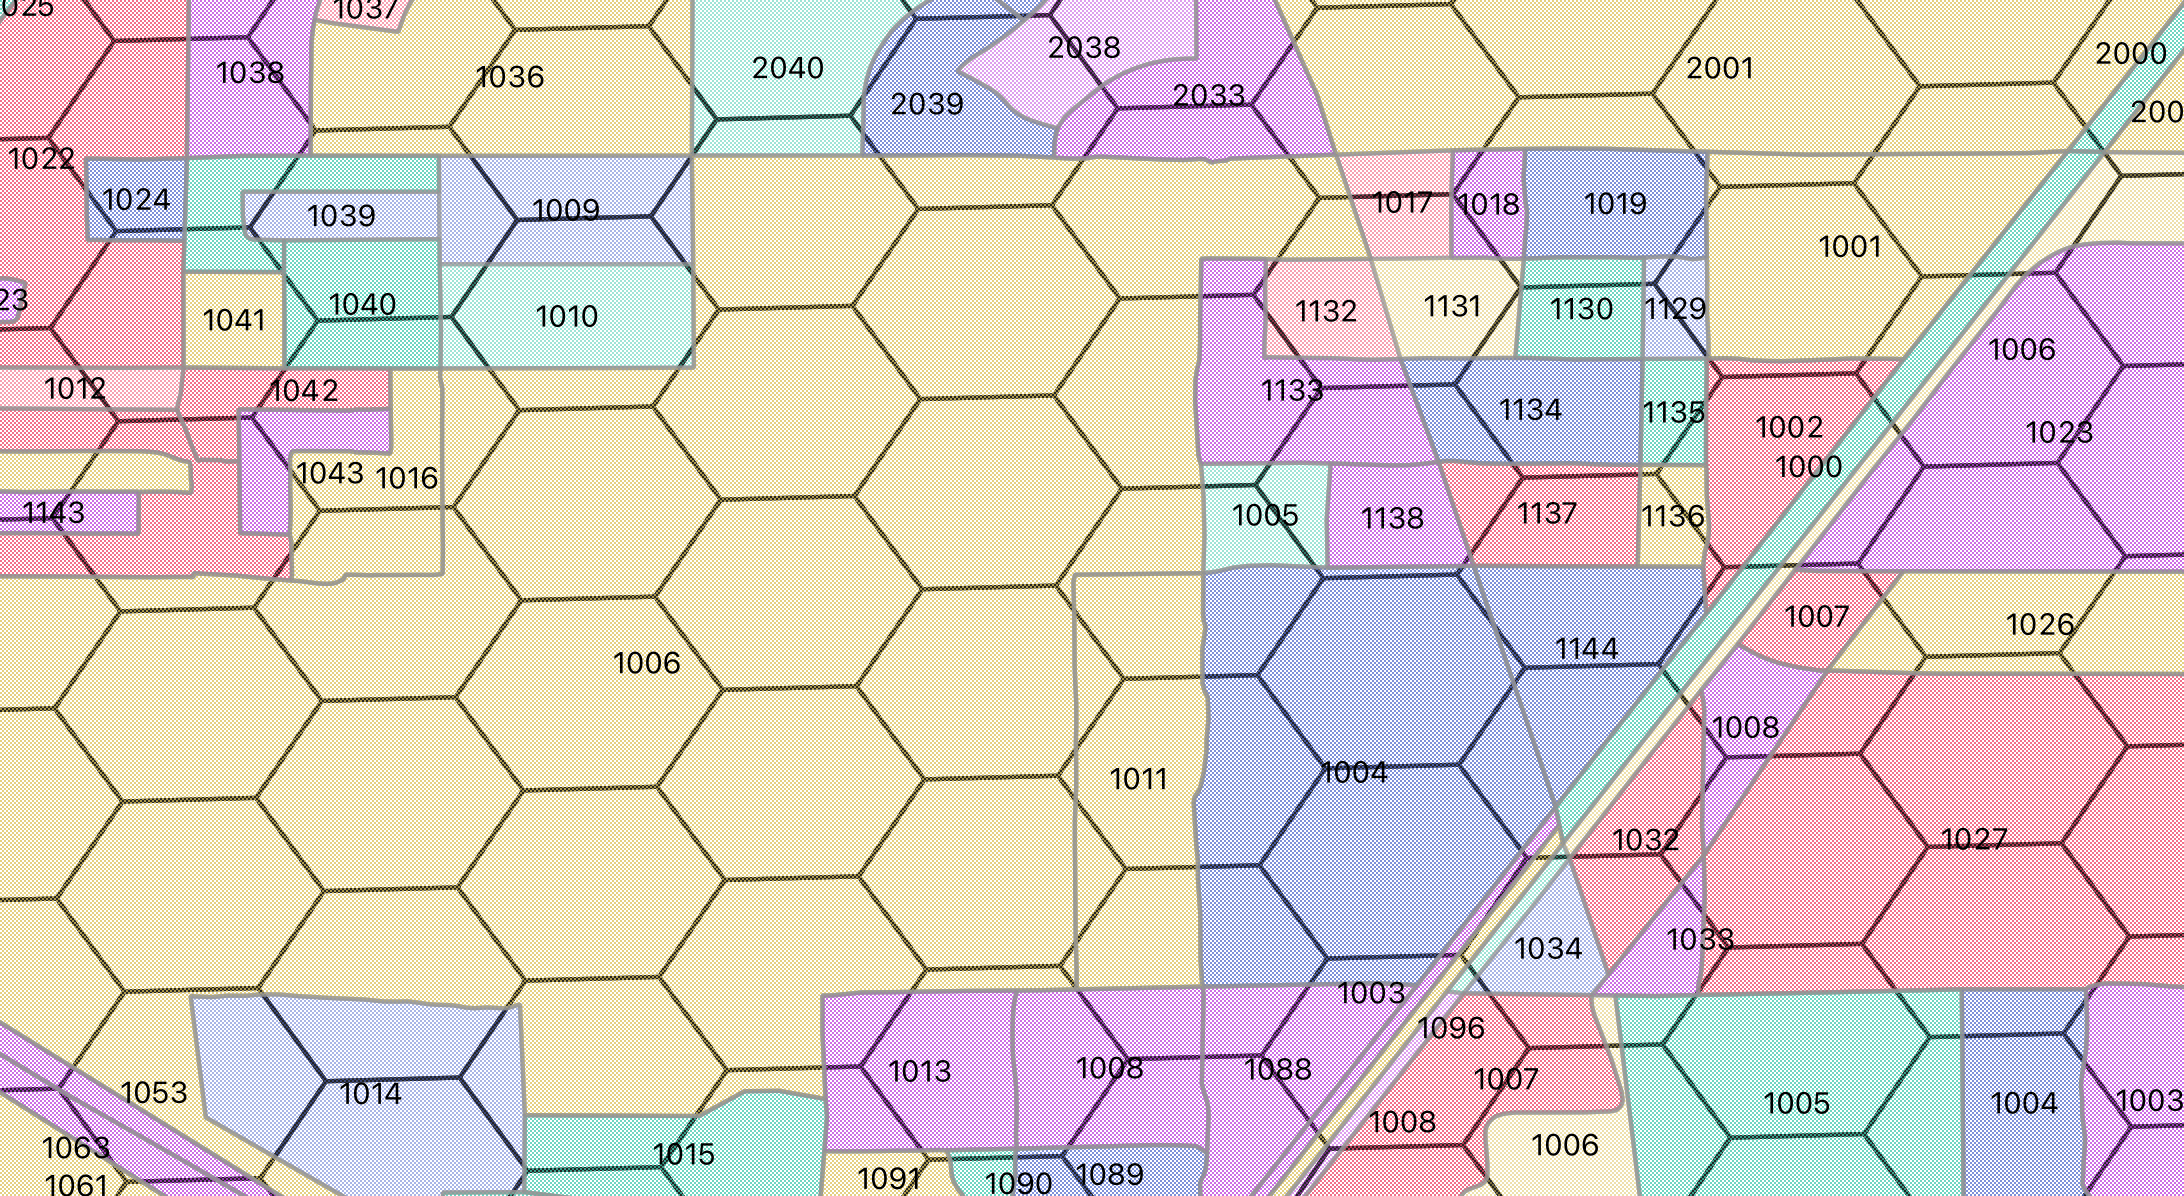
The way that Fiber is built it is easy for houses that are close to each other to not be equally serviceable. A house on the other side of a road or natural feature may be unreachable even though its neighbor has fiber. This potentially makes it more accurate to provide a list of serviceable locations.
At Hexvarium we operate a small ISP called Atherton Fiber. As part of our build process, we have the parcel data for our service area, and as we expand our service area we make note of which parcels are serviceable.
We also have our service data in a spatial database, so it is a relatively simple matter to load the Location Fabric into our database and then do a spatial query to join our serviceable parcels with the location_id from the Location Fabric.
Sample loading Location Fabric into PostGIS
We use the ogr2ogr tool from the Geospatial Data Abstraction Library (GDAL) for a lot of our spatial data manipulation. Here is a sample command to load a PostGIS database with the Location Fabric:
ogr2ogr -progress -overwrite -t_srs EPSG:4326 -s_srs EPSG:4326 \
    -f "PostgreSQL" PG:"dbname=db host=localhost port=5432 user=username password=<password>" \
    FCC_Active_06302022_ver1.csv
Sample loading Location Fabric into Google BigQuery
The ‘obvious’ way to load the data into BigQuery is to use the –autodetect flag. Unfortunately, BigQuery treats ZIP Codes and Census Blocks as integers, thus dropping leading zeroes.
A little trick is to make a copy of the data file with just the header and a few lines of data. Load that file with –autodetect, then download the autodetected schema and edit it manually, and use the edited schema to load the full data file.
Make a copy of the file and edit it manually to be just a few rows long. Or you can use the ‘head’ tool from a Linux or OSX command line.
head -10 FCC_Active_06302022_ver1.csv > small.csv
Upload the small file with –autodetect
bq load --source_format=CSV --skip_leading_rows=1 --autodetect wip.small small.csv
Retrieve the schema from BigQuery
bq show --schema --format=prettyjson wip.small > location_fabric.schema
Here is the partial schema, showing just the fields which need to be changed.
[
{
    "mode": "NULLABLE",
    "name": "zip",
    "type": "INTEGER"
},
{
    "mode": "NULLABLE",
    "name": "zip_suffix",
    "type": "INTEGER"
},
{
    "mode": "NULLABLE",
    "name": "county_geoid",
    "type": "INTEGER"
},
{
    "mode": "NULLABLE",
    "name": "block_geoid",
    "type": "INTEGER"
},
]
Change the type of those four fields to ‘STRING’ and save the schema.
Load the full Location Fabric into BigQuery
bq load --source_format=CSV --skip_leading_rows=1 wip.fcc_active_06302022_ver1 FCC_Active_06302022_ver1.csv location_fabric.schema
Next Steps
We now have the Location Fabric in a database. Depending on how you have your availability data the next steps in generating serviceable locations can be as simple as doing a spatial join, or the more complicated address matching.
Shunryu Suzuki wrote that “In the beginner’s mind there are many possibilities, but in the expert’s there are few.” After 40+ years in technology, I am clearly still a beginner, since I see many possibilities. In part 2 and part 3 we’ll look at different options for creating the data needed for the broadband availability report. First ways to match ISP service availability data with the Location Fabric, and then a way to create ‘polygon coverage areas.’
About Hexvarium
Hexvarium is a broadband service provider using proprietary Data Science to accurately identify, deliver, and connect profitable networks across all geographies. Building sustainable broadband networks is a complex puzzle of continually changing factors. Yet all other designers, engineers, and operators deploy capital using static, antiquated methods and knowledge of each community. Hexvarium’s approach delivers sustainable networks, even in the most challenging circumstances. For more information, please visit hexvarium.com.
Media Contact:
Jennifer Spoerri
Gallagher PR