Matching with the Location Fabric (BDC part 2)
Article
•
May 16, 2023
FCC Broadband Data Collection for ISPs - Part 2 Matching with the Location Fabric
Rich Gibson, Engineer, Hexvarium
May 17, 2023
FCC Broadband Data Collection for ISPs
In Broadband Data Collection for ISPs - Part 1 we discussed the FCC Form 477 and the replacement Broadband Data Collection (BDC) system. These support the National Broadband Map. We finished with instructions on how to get and load the Location Fabric, required for the BDC reporting, into a PostGIS or BigQuery table.
Availability Data
Providers are required to provide either polygons that cover their service area, or a list of locations, from the Location Fabric, where they can provide service.
Now let’s explore creating a list of serviceable locations. In Broadband Data Collection for ISPs - Part 3 we will explore ways to create polygons of servicable locations as an alternative to the list.
At Hexvarium we operate a small ISP called Atherton Fiber. As part of our build process we have the parcel data for our service area, and as we expand our service area we make note of which parcels are serviceable.·
We also have our service data in a spatial database, so it is a relatively simple matter to· load the Location Fabric into our database and then do a spatial query to join our serviceable· parcels with the location_id from the Location Fabric.
What if you don’t have parcel data?
Most counties have parcel data in a GIS format available. Try searching for ‘Shapefile parcel data [name of county]’ And then look around for ‘Download GIS data’ or the like. Once you have a shapefile of parcel boundaries you can convert it to a CSV file.
Convert the Shapefile to a CSV. I use ogr2ogr, but there are various tools to do the conversion, including online tools. The important thing is to make sure you preserve the geometry information.
ogr2ogr parcels.csv parcels.shp -lco GEOMETRY=AS_WKT
You can now that into PostGIS or BigQuery using the same steps described in part 1.
Serviceable location data?
If you don’t have address or point data for your serviceable locations then it would probably be easier to use the polygon technique from part-3. If you have address data, but not latitude and longitude then you can geocode the data. If you need help geocoding data reach out and we can send you notes on how to do it.
Assuming you have latitude and longitude for your serviceable locations you can do spatial queries to associate each of your locations with a parcel, and each of the Location Fabric points with a parcel. And then extract the location id.
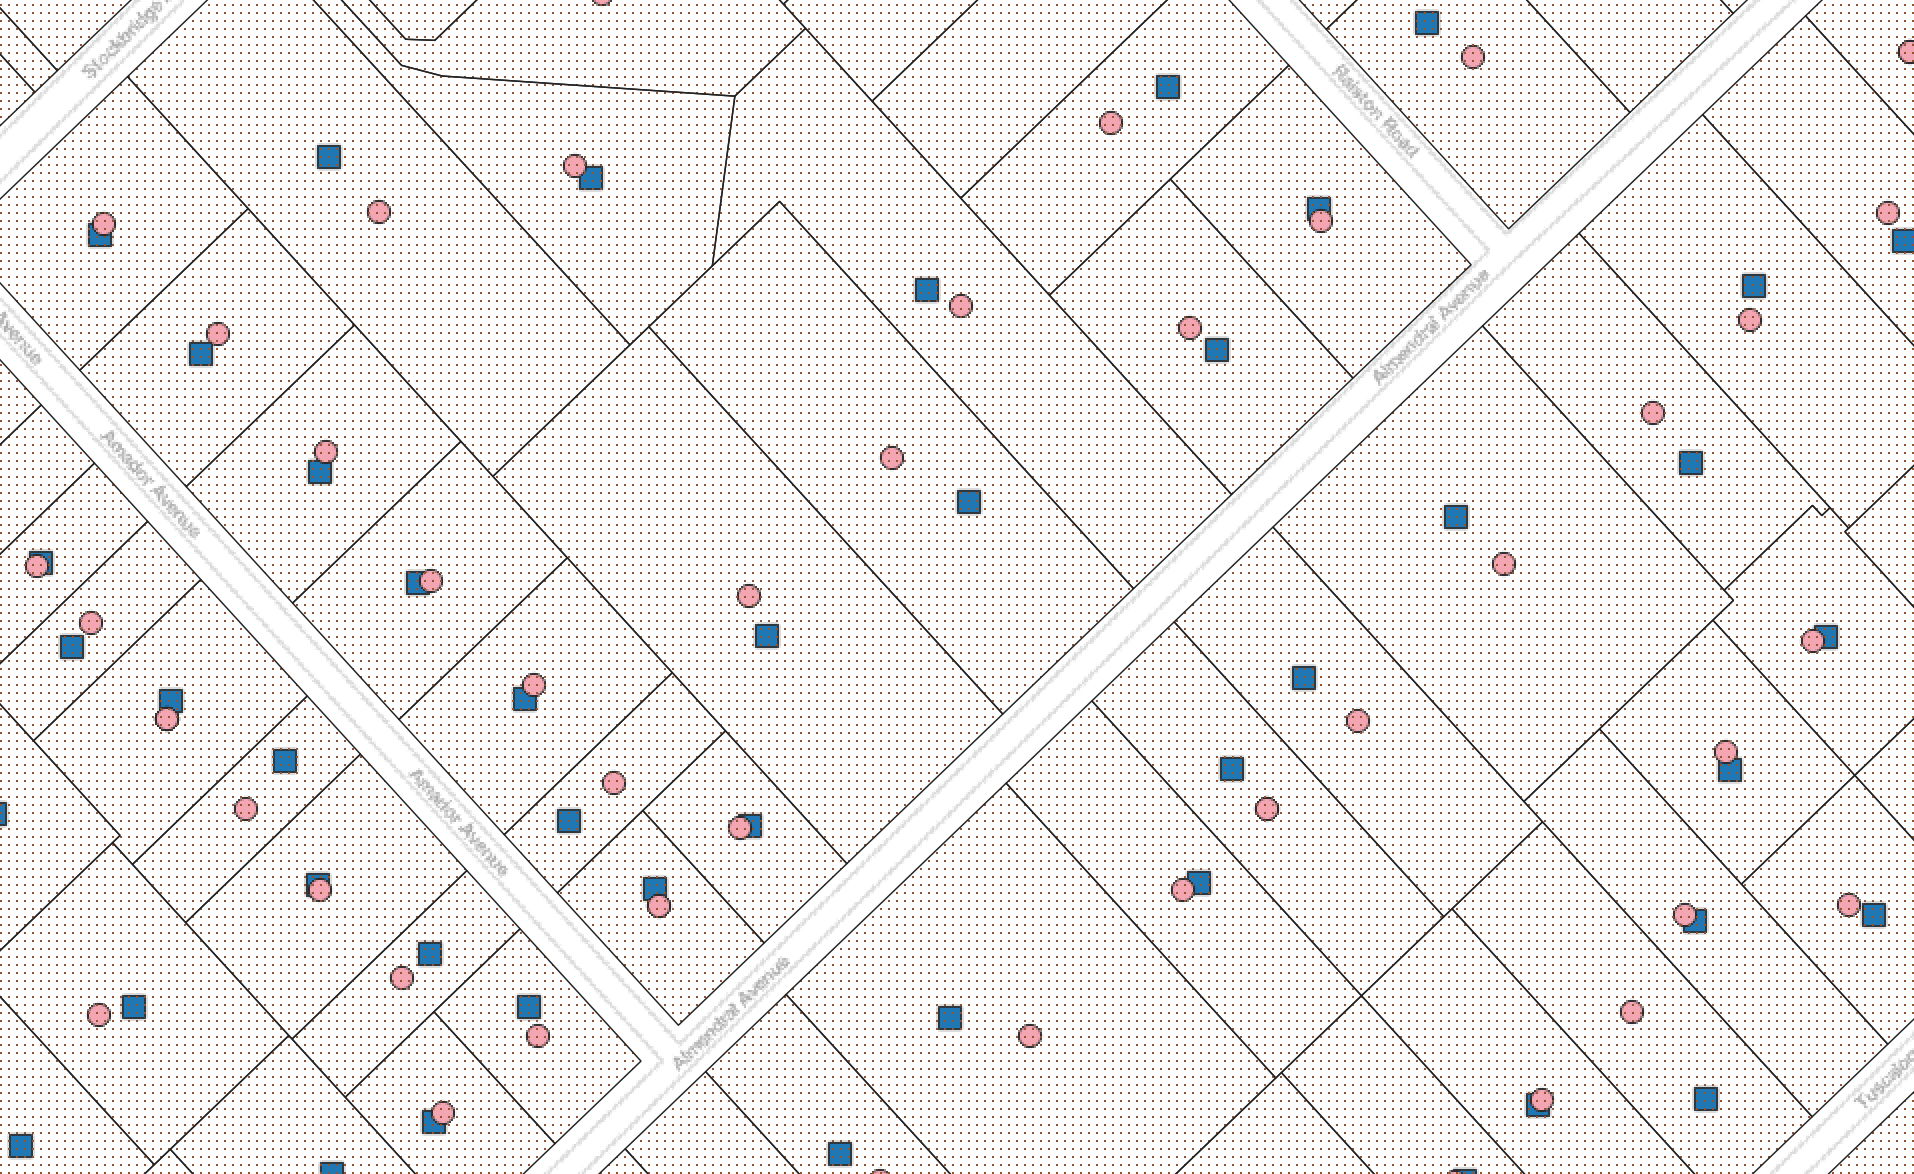
The blue squares are the Location Fabric points, red circles are the centroids of the parcels (which is what you might get from geocoding the addresses), and the black lines are the parcel boundaries.
Why so complicated? Can’t we just match the points from the serviceable locations with the points from the Location Fabric? We certainly could do a nearest neighbor query, and in this example that seems likely to be (mostly) correct.
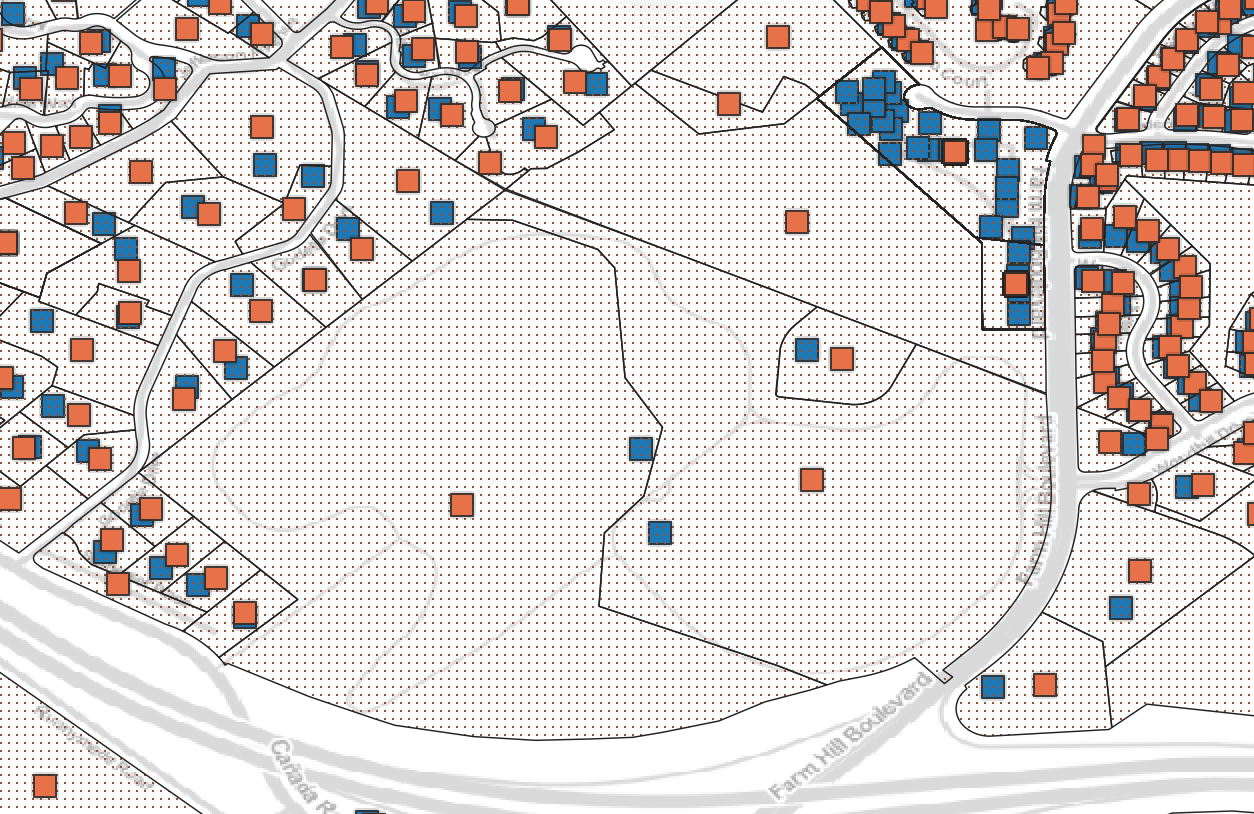
This example shows some more complicated situations, where the Location Fabric, still in blue, has points that are not as clearly as close to the parcel centroids. But those points are (not 100%, but usually) still within the parcel boundaries. And so it seems safer, and computationally cheaper, to find the parcel which contains both the point for our availability data and the point of the Location Fabric.
Sample query in PostGIS to join parcel data with Location Fabric to get location_id - probably just do BigQuery
Sample query in BigQuery to join parcel data with Location Fabric to get location_id
When manually editing data files it is absurdly easy to miss a comma or to otherwise mess up the formatting. I use a fantastic tool called VisiData to look at CSV files.
VisiData is an interactive multitool for tabular data. It combines the clarity of a spreadsheet, the efficiency of the terminal, and the power > of Python, into a lightweight utility that can handle millions of rows with ease.
(Consider this little pitch for this wonderful open source bit of code to be a partial payment of the debt I owe to Saul Pwanson and the VisiData team.)
Convert the locations.csv to a Shapefile
ogr2ogr locations.shp locations.csv
About Hexvarium
Hexvarium is a broadband service provider using proprietary Data Science to accurately identify, deliver, and connect profitable networks across all geographies. Building sustainable broadband networks is a complex puzzle of continually changing factors. Yet all other designers, engineers, and operators deploy capital using static, antiquated methods and knowledge of each community. Hexvarium’s approach delivers sustainable networks, even in the most challenging circumstances. For more information, please visit hexvarium.com.
Media Contact:
Jennifer Spoerri
Gallagher PR