Creating polygon coverage areas (BDC part 3)
Article
•
May 17, 2023
FCC Broadband Data Collection for ISPs - Part 3 Creating polygon coverage areas
Rich Gibson, Engineer, Hexvarium
May 18, 2023
FCC Broadband Data Collection for ISPs
In Broadband Data Collection for ISPs - Part 1 and and Broadband Data Collection for ISPs - Part 2 we discussed the FCC Form 477 and the replacement Broadband Data Collection (BDC) system, and explored ways to match serviceable locations with the Location Fabric using geospatial queries.
Now let’s explore creating availability data by creating polygons of serviceable locations.
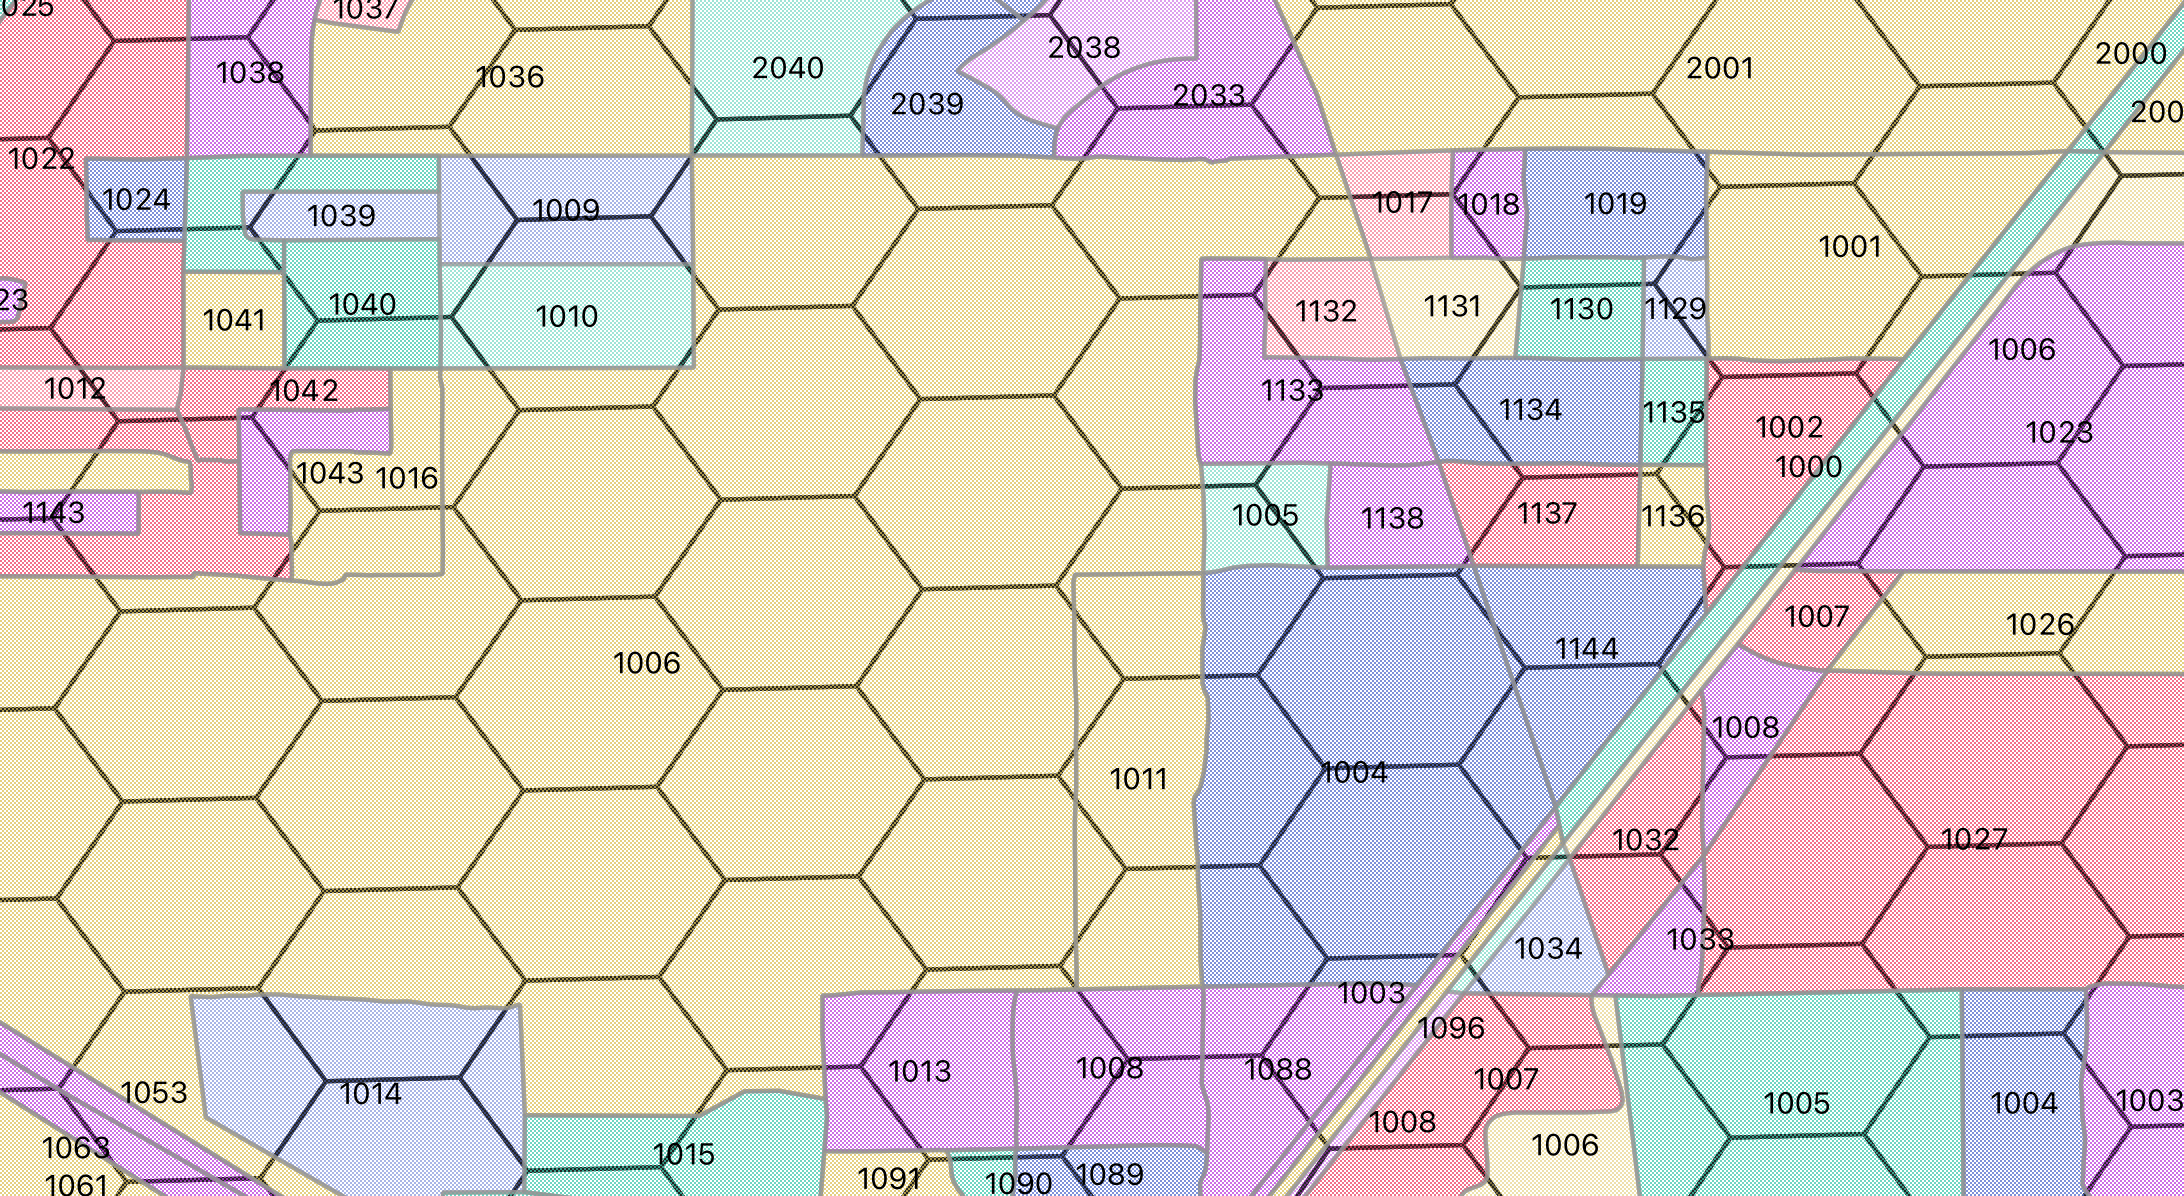
Polygons
If you have accurate maps of your coverage areas you can file polygons of serviceable locations. One way to generate these polygons is to use Google Earth and some other tools.
* Start Google Earth
* Add->Folder Create a new folder called 'location'
* Add->Polygon give the polygon a name, click on the map to define your coverage
  area. You can have multiple polygons.
* Right click the 'locations' folder. Select 'Save Place As' and save
  it as locations.kml
* Edit the file to add the required information for the BDC report.
* You need a distinct polygon for each area that has a different value.
Each polygon must have a single value for each of the following fields: technology code (“technology”) maximum advertised download speed (“maxdown”) maximum advertised upload speed (“maxup”) low latency flag (“lowlatency”) business / residential code (“bizrescode”)"
Adding fields
The locations.kml file needs to be augmented with the BDC fields for providerid, brandname, technology, maxdown, maxup, lowlatency, and bizrescode.
One way to add these is to use an online KML to GeoJSON Converter and then manually edit the GeoJSON. The FCC accepts GeoJSON format, so if you are comfortable editing JSON files this is a fine path.
I prefer CSV files. So another path is to convert the KML to CSV, then manually add the additional fields, and finally to convert that CSV to a Shapefile (or one of the other acceptable formats defined in section 6.2.2 of the FCC Docs
As in parts 1 and 2, we use the ogr2ogr tool from the Geospatial Data Abstraction Library (GDAL) for much of our spatial processing (I wrote a haiku about ogr2ogr, but it appears mercifully to have been lost).
ogr2ogr locations.csv location.kml -lco GEOMETRY=AS_WKT

####
The converted CSV File looks like this:
````bash
WKT,Name,Description
"POLYGON Z ((-122.1914 37.4352 0,-122.1898 37.4371 0,-122.1922 37.4384 0,-122.1939 37.4364 0,-122.1914 37.4352 0))",,
Edit the CSV file to add the additional fields, and remove the unused Name and Description fields by removing both their names in the header row and the two commas at the end of the line where the name and description data go.
providerid, brandname, technology, maxdown, maxup, lowlatency, bizrescode, WKT
131425, Sky High LLC, 50, 450, 100, 1, X, "POLYGON Z ((-122.1914 37.4352 0,-122.1898 37.4371 0,-122.1922 37.4384 0,-122.1939 37.4364 0,-122.1914 37.4352 0))"
When manually editing data files it is absurdly easy to miss a comma or to otherwise mess up the formatting. I use a fantastic tool called VisiData to look at CSV files.
VisiData is an interactive multitool for tabular data. It combines the clarity of a spreadsheet, the efficiency of the terminal, and the power > of Python, into a lightweight utility that can handle millions of rows with ease.
(Consider this little pitch for this wonderful open source bit of code to be a partial payment of the debt I owe to Saul Pwanson and the VisiData team.)
Convert the locations.csv to a Shapefile
ogr2ogr locations.shp locations.csv
Since you have installed the GDAL tools, you can check the shapefile with ogrinfo
ogrinfo locations.shp locations
You are allowed to submit multiple GIS formatted files, for example, if you currently have data by region or state you do not need to merge them into one Shapefile.
When you have all of your shapefiles create a Zip archive file of them. Remember to include all of the files that make up your Shapefile, locations.shp, locations.shx, locations.dbf, and locations.prj.
In part-4 we will cover additional steps in uploading and verifying the BDC data.
About Hexvarium
Hexvarium is a broadband service provider using proprietary Data Science to accurately identify, deliver, and connect profitable networks across all geographies. Building sustainable broadband networks is a complex puzzle of continually changing factors. Yet all other designers, engineers, and operators deploy capital using static, antiquated methods and knowledge of each community. Hexvarium’s approach delivers sustainable networks, even in the most challenging circumstances. For more information, please visit hexvarium.com.
Media Contact:
Jennifer Spoerri
Gallagher PR